Reporting the easy way
Having a lot of data is useless without a good way to analyze it. With our reporting tool, you can filter your data using conditional filters, which allow you to extract exactly the data you need. If you combine conditional filters with the time range filter, you can check the data your respondents have provided, down to the minute level!
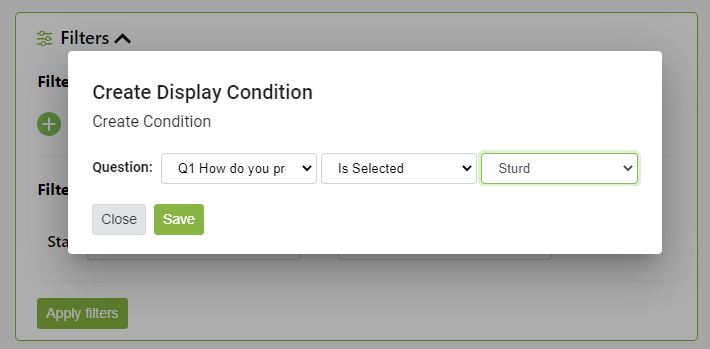
Conditional filters give you the power of specific data
Conditional filters are perfect when you want to segment out a specific type of data, such as which respondents like vegetarian food and what the specific respondent segment thinks about a range of restaurants that specialize in vegetarian food? Choose a question and the type of filter you want to apply and watch as your data is transformed into useful facts about your customers or members' habits, or opinions, about certain products or services.
You can of course combine several different condition filters to get even more specific data points by simply adding another filter.
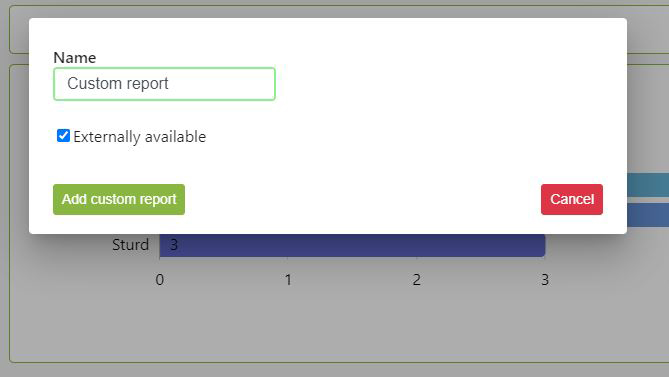
Create custom reports with the click of a button
Sometimes you just need a couple of graphs to make a point. With our “Save Custom Report” feature, you can easily choose which graphs to include and create custom reports for different types of presentations. If your survey contains lots of conditional-based questions (Read more about question logic here), the reporting tool allows you to create an infinite number of custom reports that allow you to break down your raw data and create a better overview of the results.
Share your reports
Do you want to share a report without letting unauthorized people into your account? No problem, you can easily create a shareable report and send it to anyone with the click of a button! The shareable report consists of a public URL that you can post on your intranet or share with your customers or members if you want them to be involved in the survey results.